
Documentation
RustMinerSystem Port Detail and Miner Management
Use the RustMinerSystem port detail page to inspect overview charts, devices, wallets, TCP connections, connection logs, and port configuration.
Port Detail and Miner Management
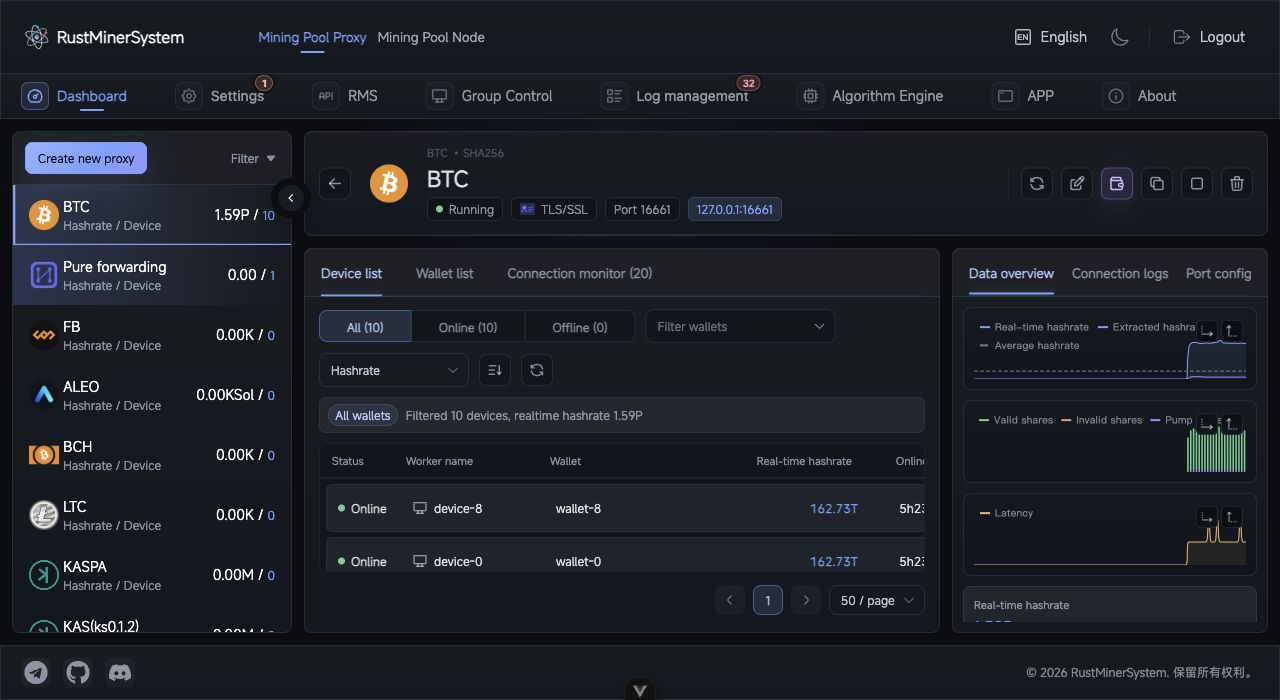
Port detail page: manage workers, wallets, TCP connections, overview charts, port configuration, and connection logs in one workspace.
The port detail page is the main place to investigate a single proxy port. Open it by clicking a port row or choosing View workers.
Top Actions
The header shows coin, protocol, port, remark, status, and miner connection address. It also provides refresh, edit, hot update, clone, start/stop, delete, and copy-address actions.
Overview
The overview area displays:
- Real-time, fee, and average hashrate.
- Valid, invalid, and fee share trends.
- Latency trend.
- Online devices, offline devices, average latency, and connection count.
- Coin-specific warnings.
Chart axis buttons let you reveal X/Y labels when you need more detail.
Device List
The device list supports online/offline filters, wallet filters, sort fields, sort direction, refresh, and pagination. Rows show status, worker name, wallet, real-time hashrate, online duration, concurrency, efficiency, fee ratio, disconnect count, and latency.
Click a worker row to open worker detail with hashrate trend, share trend, metadata, connection logs, and worker error logs.
Wallet List
The wallet list summarizes online/offline device counts, hashrate, and fee-ratio state per wallet. You can favorite wallets, filter devices by wallet, and set wallet-level independent fee ratios.
Fee priority is:
Worker independent ratio > Wallet independent ratio > Port default ratio
TCP Monitor and Logs
TCP Monitor shows live TCP connections, IP address, entry time, and GID. Connection count is not the same as miner count.
Connection Log shows port-level connection events, while Port Config summarizes the effective listening protocol, pool, backup pool, wallet, and fee settings.
For troubleshooting, check configuration first, then TCP connections, devices, connection logs, and finally upstream pool worker data.